Forget all your concerns about dashboards, reporting and CX analysis. Don’t worry about setting up complex BI to analyze and understand your CX data. Stop worrying about internal specialist resources not being available or expensive external consultants.
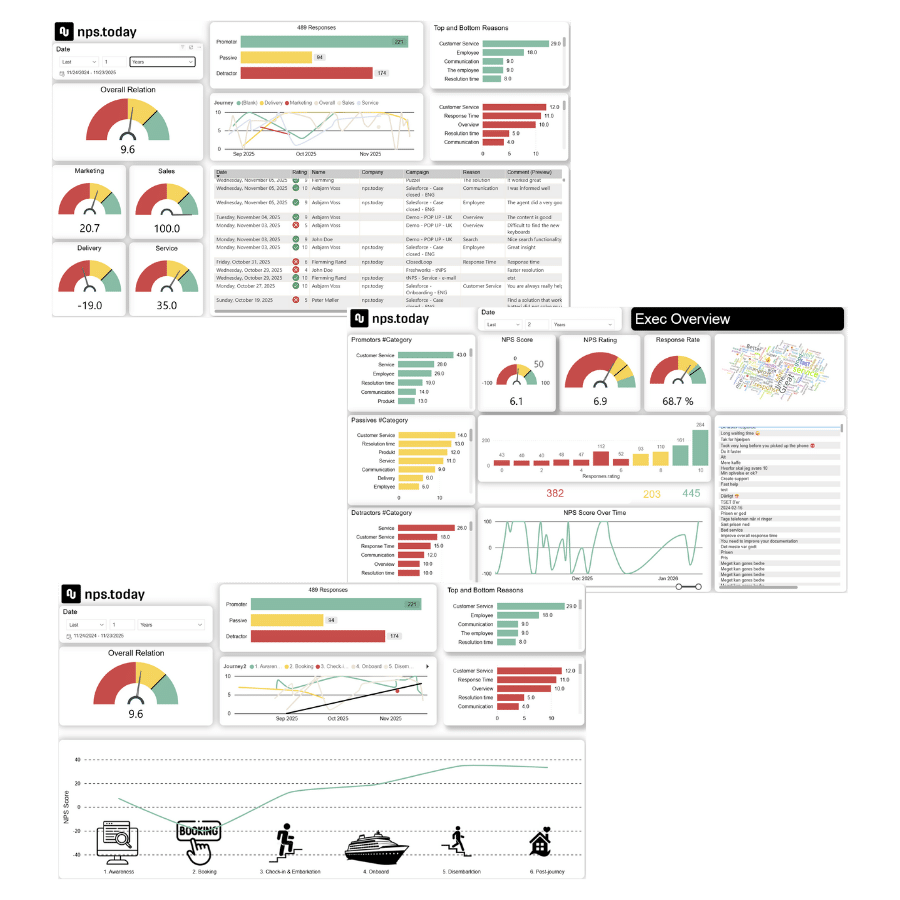
With nps.today Power Dashboards you get a full scale prebuilt CX BI app based on Microsoft Power BI ready to plug-in and start using.
Power Dashboards
With nps.today Power Dashboards, there’s no need to learn a new dashboarding or data analytics tool – or settle for the limitations of vendor-specific platforms.
Power Dashboards is a native Microsoft Power BI app, seamlessly connected to nps.today. It’s delivered as a complete Power BI file that can be fully extended, customized, and integrated with your existing data sources. Power Dashboards offer intuitive, interactive plug-and-play dashboards – perfect for both high-level insights and deep-dive feedback analysis.
Additionally, Power Dashboards is pre-connected to services for open text response translation into English, enabling enriched and consistent analysis across multiple languages.
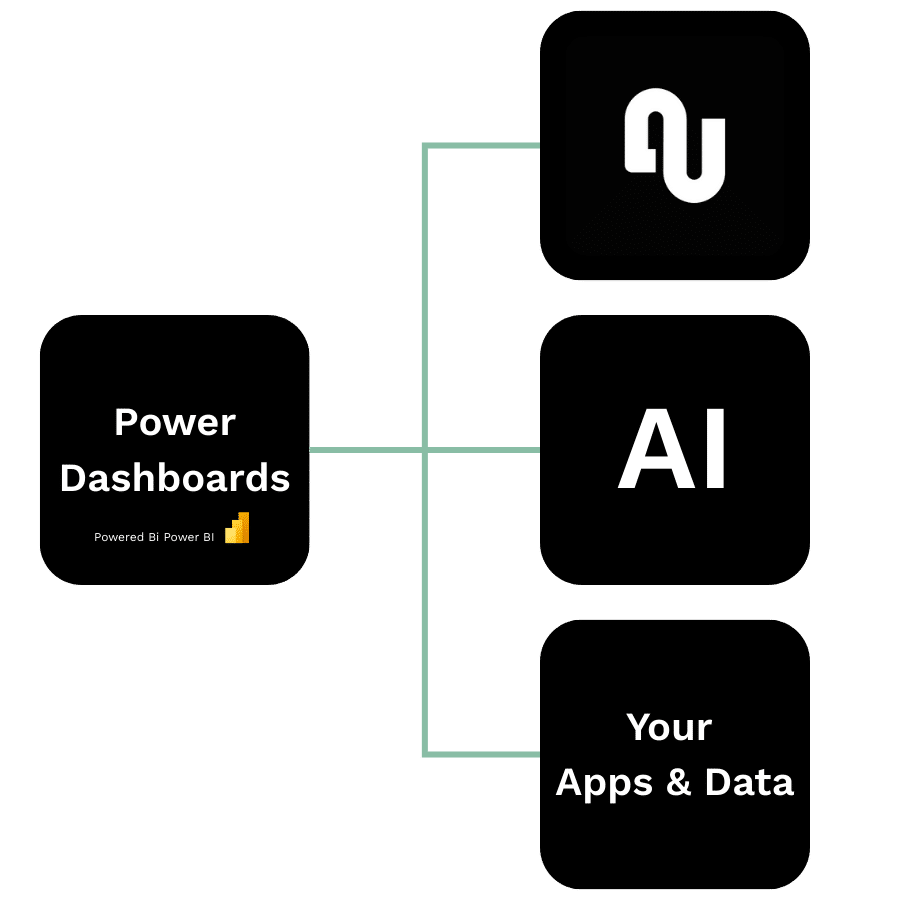
Connect Power Dashboards to your preferred AI solution
Just as nps.today Power Dashboards builds on industry-standard Power BI for its Insights solution, you can also integrate advanced AI features from Microsoft Azure AI (Cognitive Services) or other preferred AI service.
Power Dashboards includes pre-configured integration to services for feedback enrichment, such as free text translation, sentiment, reason categorization and feedback summaries.
To add Microsoft AI to Power Dashboards, a Microsoft Power Automate Flow subscription, Power BI Pro subscription and the associated AI Builder credits is needed.
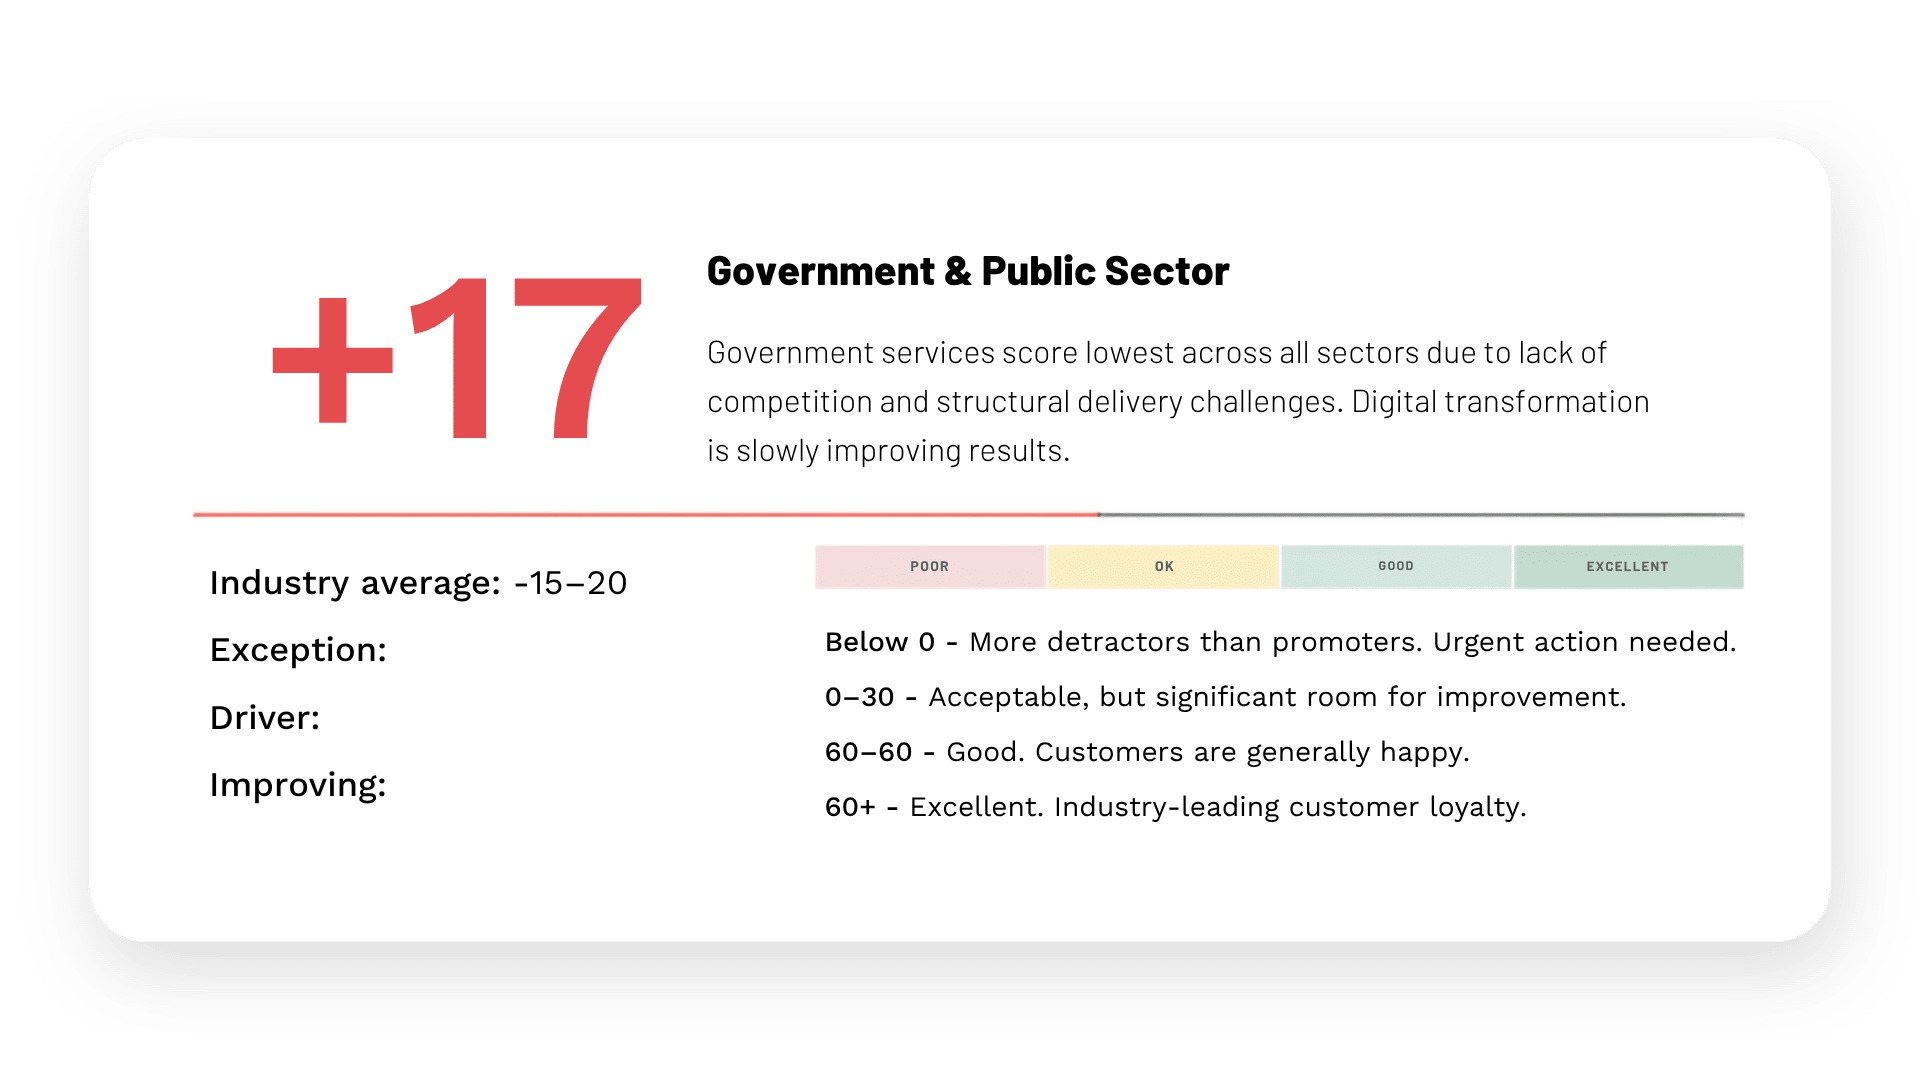
See the NPS score in your industry
Access the 2025 Net Promoter Score benchmarks across 33 industries — compiled from over 5.4 million survey responses.