Industry Intelligence
How does your
industry score on NPS?
Access the 2025 Net Promoter Score benchmarks across 33 industries — compiled from over 5.4 million survey responses. See exactly where your sector stands and what separates leaders from laggards.
33+
Industries
5.4M
Responses
2025
Latest data
Free benchmark
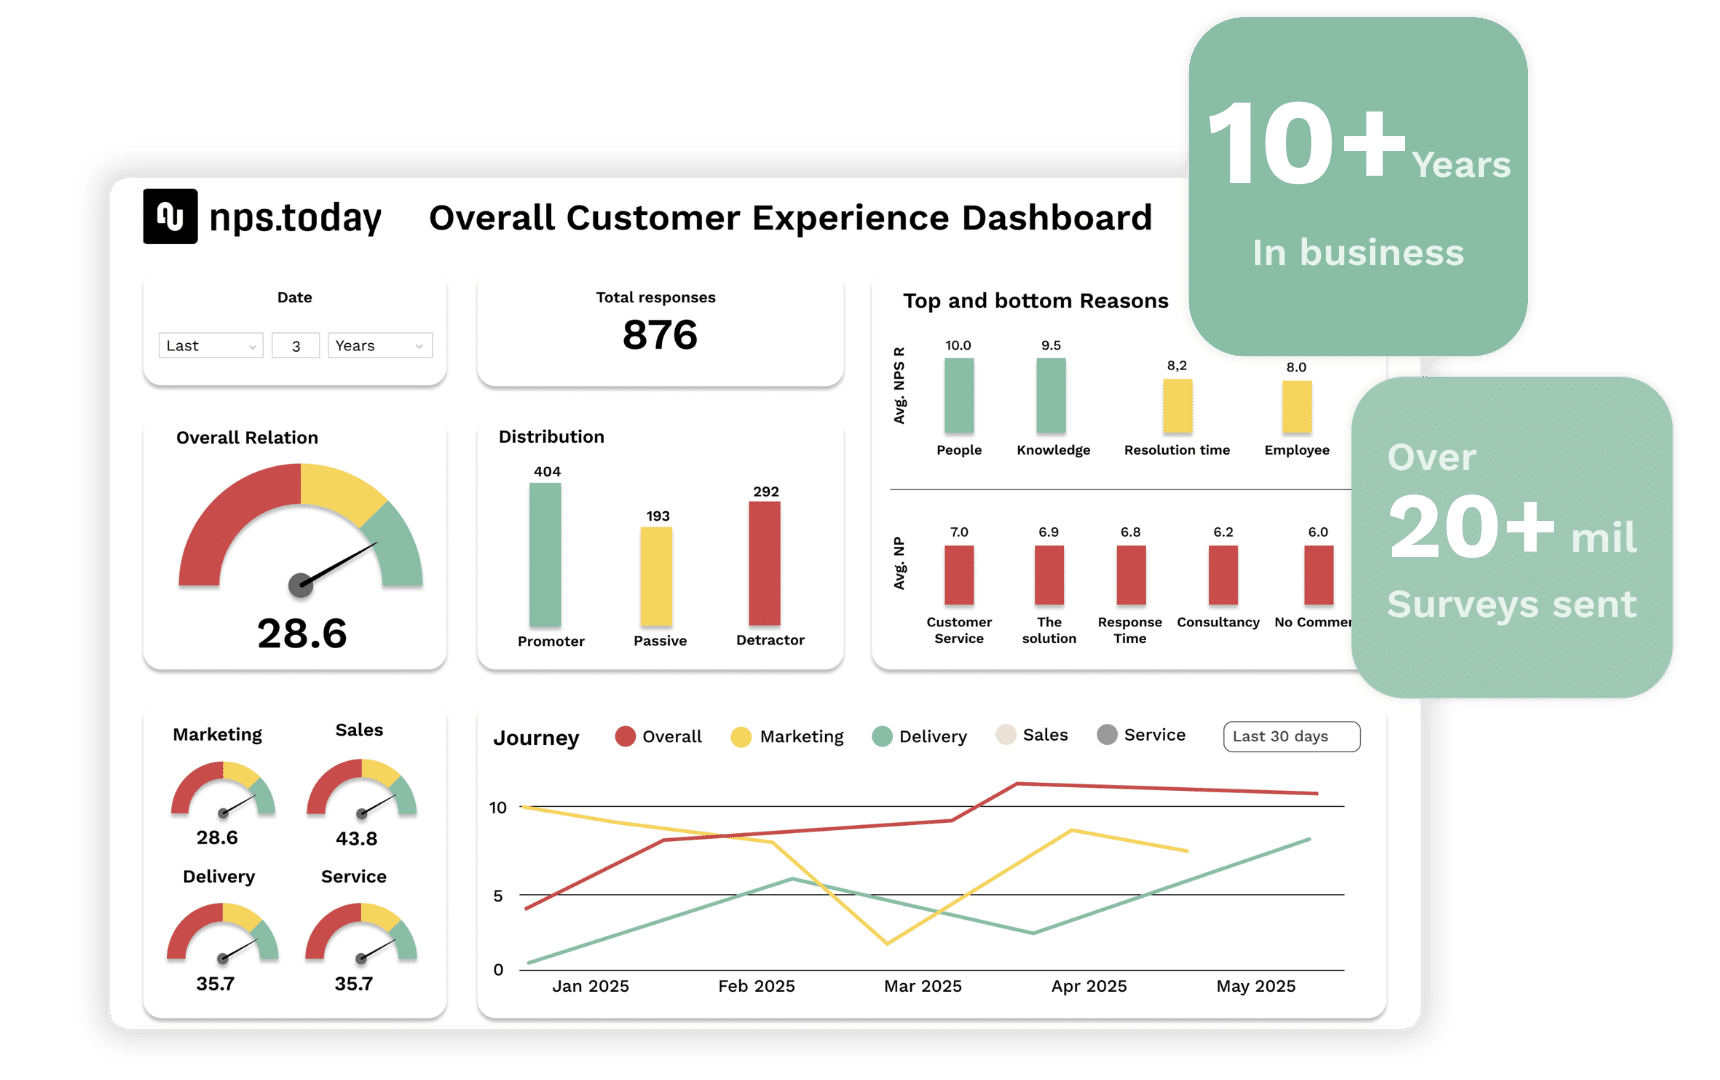
See the average NPS score for your industry
Select your industry and instantly see how companies in your sector perform on NPS — the average score, what drives it, and how the leaders stand out.
Note: You are not signing up for any newsletter.
👁
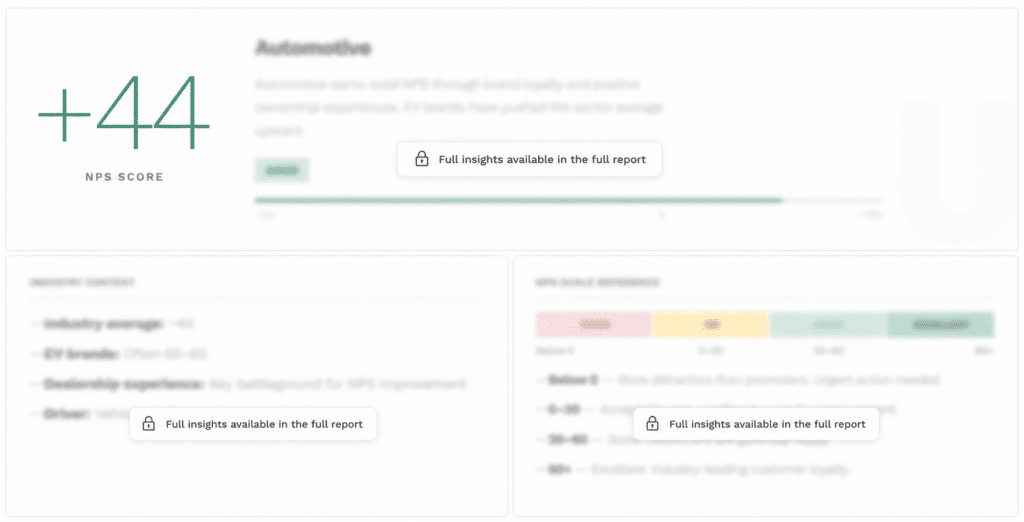
Preview example — see what result you will get
↓
Example only — not your actual score
+35
NPS Score
SaaS / Software
Below Average
Software companies face a wide performance gap. B2C SaaS significantly outperforms B2B SaaS, driven by higher enterprise expectations.
−1000+100
Industry Context
- —Median score (2025): 35
- —Top challenge: Complex feature sets
- —Lever: Proactive onboarding
NPS Scale
Poor
OK
Good
Excellent
Below 00–3030–6060+
— Select your industry —
↓
Airlines & Aviation
Automotive
Banking & Financial Services
Car Rental
Cloud & Hosting
Construction
Consulting & Advisory
Consumer Electronics
Cybersecurity
E-Commerce / Online Retail
Education & EdTech
Energy & Utilities
Fintech / Financial Technology
Food & Beverage
Gaming
Government & Public Sector
Grocery & Supermarkets
Healthcare & Medical Services
Hospitality & Hotels
HR & Staffing
Insurance
Legal Services
Logistics & Supply Chain
Manufacturing
Marketing & Creative Agency
Media & Entertainment
Non-Profit & NGO
Pharmaceuticals
Real Estate
Retail (Brick & Mortar)
SaaS / Software
Telecommunications
Travel & Tourism
By submitting the form, you accept our Privacy policy.
Your benchmark is ready
Welcome, —
—
NPS Score
—
—
—
−1000+100
Industry Context
NPS Scale Reference
Poor
OK
Good
Excellent
Below 00–3030–6060+
Below 0 — More detractors than promoters. Urgent action needed.
0–30 — Acceptable, but significant room for improvement.
30–60 — Good. Customers are generally happy.
60+ — Excellent. Industry-leading customer loyalty.
NPS Score — All Industries Ranked
Your industry is highlighted. Bars show the average NPS score for each industry in the 2025 benchmark study.
Your industry
60+ Excellent
Other industries
Below 0 Poor
Want to measure your own NPS?
Start a free NPS survey today and compare your score against your industry benchmark in real time.
Data sources: 1.2m responses from nps.today + publicly available survey data from Survicate, Retently, SurveySensum & XM Institute. nps.today does not guarantee the accuracy of data from other sources.
Your Benchmark overview includes
-
Your industry NPS score
See the average NPS benchmark for your selected industry based on 2025 data. -
Industry context
Understand where your sector stands and what the benchmark means for customer loyalty. -
NPS scale reference
See how the score compares across Poor, OK, Good and Excellent NPS ranges. -
Compare your own NPS
Use the benchmark as a reference point and start a free NPS survey to see how your company compares.

Select your industry
Choose the industry or sector that best matches your business

See your benchmark
Get instant acvess to the NPS benchmark overview

Compare your own NPS
Measure your NPS and compare it against your industry
Ready to get started
Ready to make feedback operational?
See how nps.today helps your team collect feedback,
analyze it with AI and turn insights into follow-up.
- NPS, CSAT & CES surveys
- Dashboards and AI feedback insights
- Automated follow-up workflows